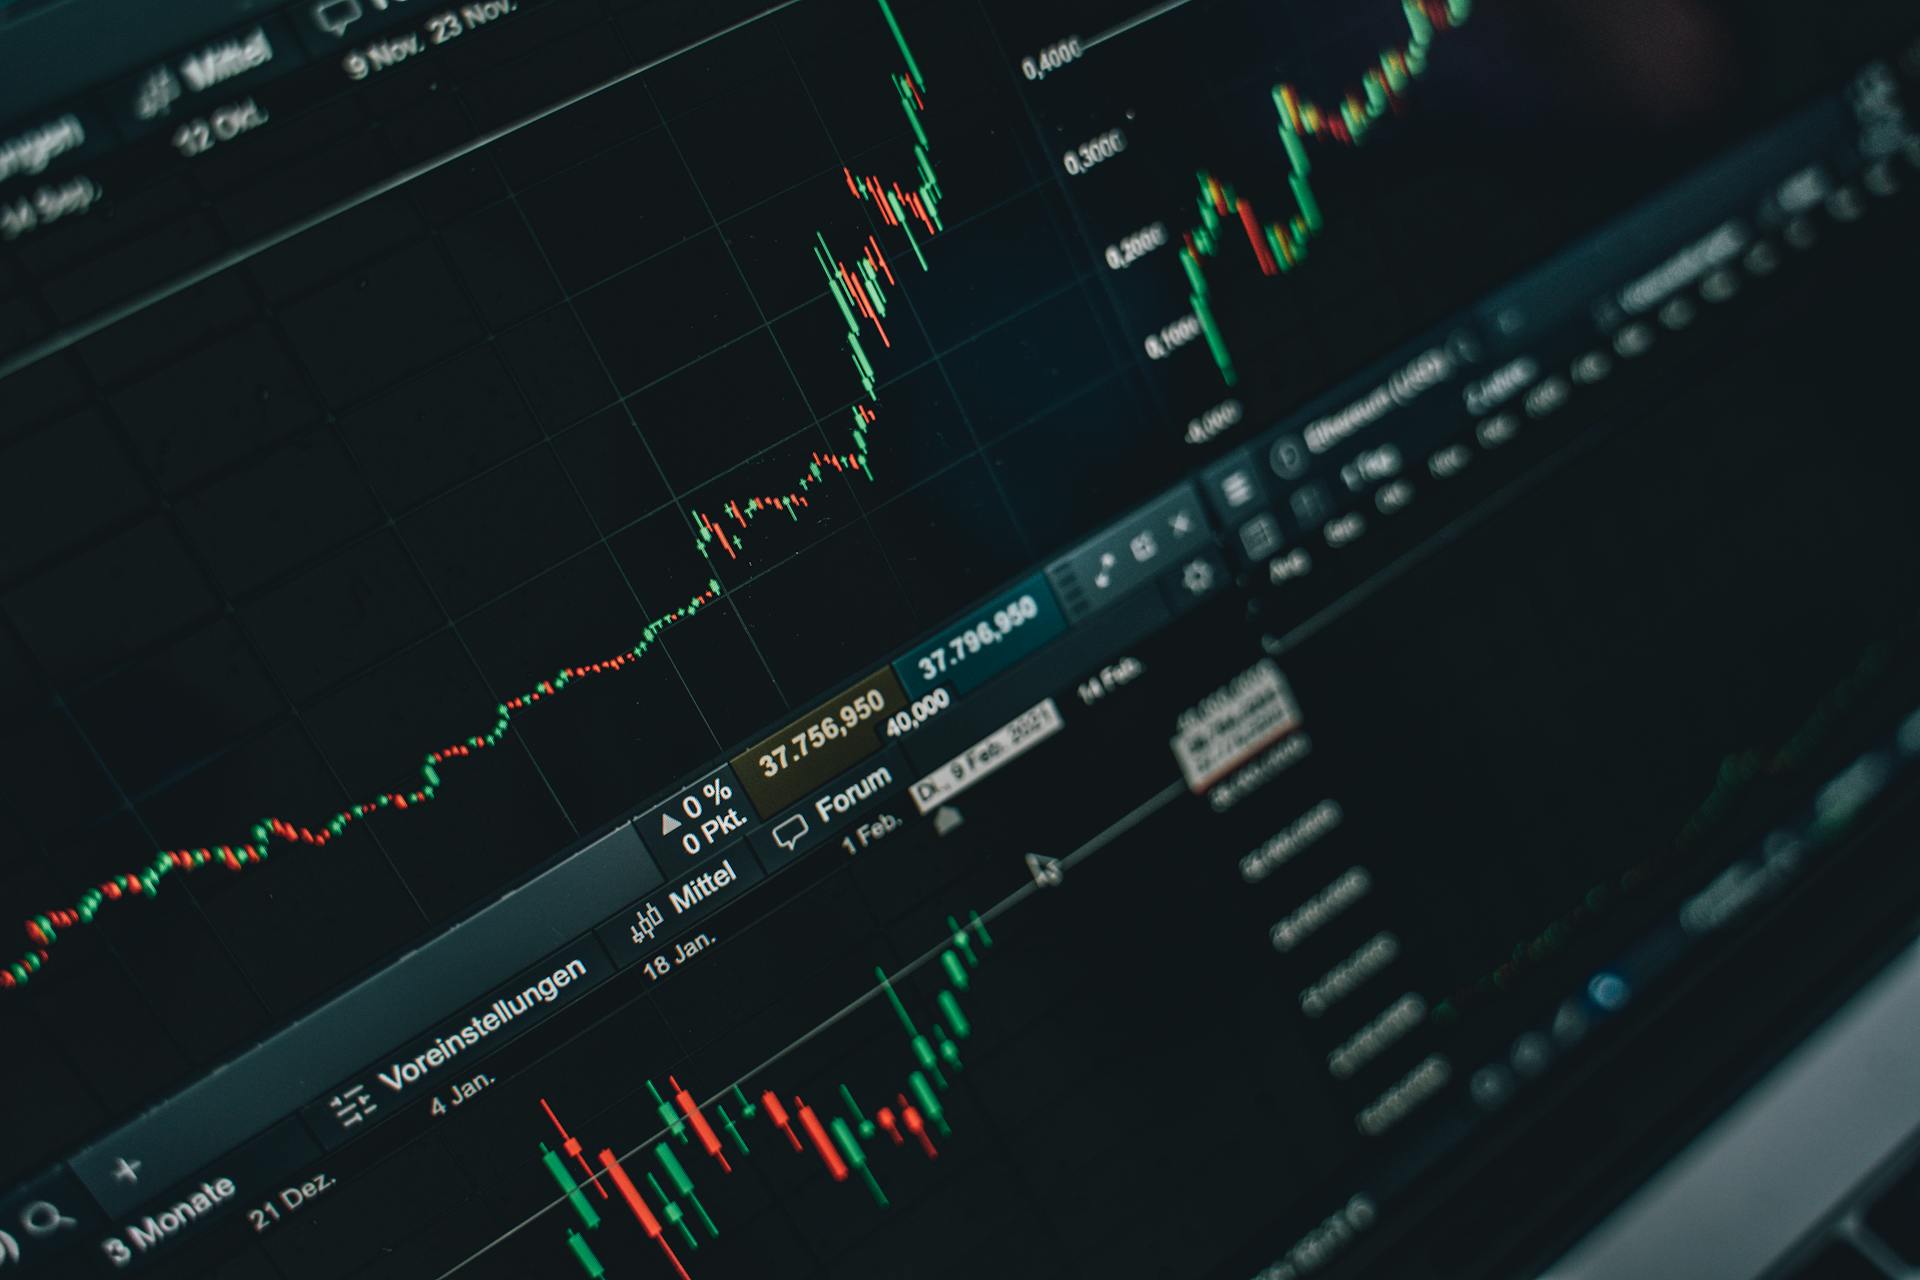
Testing your strategy on TradingView is a crucial step to ensure its success. To start, you need to backtest your strategy using historical data to see how it would have performed in the past.
This process helps you identify potential flaws and areas for improvement.
You can use TradingView's built-in backtesting tool to test your strategy on various time frames and markets, such as 1-minute charts or daily charts on the S&P 500.
By doing so, you can refine your strategy and increase its chances of success.
Testing Strategies
Testing Strategies on TradingView is a breeze, thanks to their intuitive interface and powerful backtesting tools. You can access and apply strategies with just a few clicks.
To get started, you'll want to set custom date ranges to analyze specific periods, such as a volatile month or different market conditions. This feature is particularly useful for assessing whether your strategy holds up under various market conditions.
The Strategy Tester panel is where the magic happens, filling with data as soon as you add a strategy. This is your first real step in figuring out how to backtest a trading strategy the right way. You'll immediately see the simulated buys and sells plotted on your chart, giving you a quick visual gut check on how it performed.
The real power of TradingView's backtesting lies in its speed – you can let the platform crunch years of historical data in a matter of seconds. This is a game-changer for systematic traders, allowing you to test a dozen ideas in the time it would take to analyze one manually.
Here's a quick rundown of the basic flow:
- Select a strategy
- Run the numbers
- Interpret the report
This loop is the core routine for any systematic trader. By mastering this process, you can validate and refine your backtest trading strategy to boost profits.
To load built-in strategies, start with a clean chart and access the Strategy Tester tab. From there, open the strategy library and select a built-in strategy, such as the momentum strategy. Once loaded, the tester is immediately populated with performance data.
Manual Testing
Manual testing is a crucial step in validating your trading strategy on TradingView. You can start by opening a chart of the financial instrument you want to backtest and finding the Bar Replay icon on the top-right side of the chart.
To set up your backtest, move the cursor to where you want to start and click to set the starting point. Then, use the play, forward, or reverse buttons to move through the price data one bar at a time. As you move through the data, manually execute trades based on your strategy's rules, including entry and exit points, risk management parameters, and stop-loss and take-profit levels.
To document your results, make sure to record all trade outcomes, including entry/exit prices, stop-loss, take-profit levels, and trade outcomes. This will help you evaluate the performance of your strategy and identify areas for improvement.
Additional reading: Company Exit Strategy
Loading and Using
Loading a chart is the first step in manual backtesting. Open the desired chart of the financial instrument you wish to backtest on TradingView.

To access the Bar Replay tool, find the icon on the top-right side of the chart. This tool will allow you to move through the price data one bar at a time, giving you a closer look at the market's behavior.
To manually execute trades, use the play, forward, or reverse buttons to move through the data. As you move through the data, apply your strategy's rules to decide on trade entries and exits.
To document results, record all trade outcomes, including entry/exit prices, stop-loss, take-profit levels, and trade outcomes. This will help you analyze the performance of your strategy.
The Strategy Tester on TradingView provides comprehensive performance analysis for your trading rules. It enables you to visualize the equity curve, monitor drawdowns, analyze detailed trade data, and compare with buy-and-hold.
To load a built-in strategy in the Strategy Tester, access the Strategy Tester tab at the bottom of the TradingView interface, open the strategy library, and select a built-in strategy.
To customize the Strategy Tester for realistic results, configure your initial balance, choose the right base currency, and input realistic commission fees and slippage values.
Discover more: Executive Outcomes
Steps to Futures Trading

Manual testing is a crucial step in futures trading, and it's essential to do it right. You want to test your strategies before putting real money to work.
To start, you need to decide on the duration and type of data. For short-term strategies on minute charts, a few weeks might suffice, while years of data are preferable for daily or weekly charts.
Before you begin testing, clearly define the rules of your strategy. This includes entry and exit points, risk management parameters, stop-loss, and take-profit levels. Your strategy should be unambiguous, leaving no room for subjective interpretation.
Use TradingView's Rewind tool to return the chart to your desired starting point. This way, you're not influenced by the knowledge of future price movements.
As you simulate trades, move forward, bar by bar, or candle by candle. Every time your strategy's conditions are met, note down potential trades – entries and exits.
To keep track of your results, tally the wins and losses. This will give you an overview of the potential of your strategy.
A unique perspective: Backflow Testing
Manual

Manual testing is a hands-on approach to evaluating your trading strategy. You can use TradingView's Bar Replay function to manually backtest your strategy.
To get started, open a chart on TradingView and find the Bar Replay icon on the top-right side of the chart. This is where you'll be able to move through the price data one bar at a time.
As you move through the data, apply your strategy's rules to decide on trade entries and exits. You can use the play, forward, or reverse buttons to control the playback.
To document your results, make sure to record all trade outcomes, including entry/exit prices, stop-loss, take-profit levels, and trade outcomes. This will help you keep track of your strategy's performance.
Here's a step-by-step guide to manual testing with the Bar Replay function:
- Open a Chart: Visit TradingView and open the desired chart of the financial instrument you wish to backtest.
- Bar Replay Tool: On the top-right side of the chart, find the Bar Replay icon.
- Setting Start Point: Move the cursor to where you wish to start your backtest and click to set the starting point.
- Playback Control: Utilize the play, forward, or reverse buttons to move through the price data one bar at a time.
- Manually Execute Trades: As you move through the data, apply your strategy’s rules to decide on trade entries and exits.
- Document Results: Make sure to record all trade outcomes, including entry/exit prices, stop-loss, take-profit levels, and trade outcomes.
Automated Testing
Automated testing is a crucial step in evaluating your trading strategy's performance. You can access the Strategy Tester at the bottom of your chart.
To get started, simply click on the "Add to Chart" button in the Pine Script editor after writing or importing your strategy. This will overlay the strategy on your main chart.
The Strategy Tester will summarize your strategy's performance based on historical data, displaying metrics like Total Net Profit, Max Drawdown, and Percentage of Profitable Trades.
You can refine your strategy's parameters in the Pine Script code and re-run the Strategy Tester to optimize your strategy. This process allows you to tweak and analyze your trading algorithms without needing to write new code.
Here's a quick rundown of the Strategy Tester's features:
- Total Net Profit
- Max Drawdown
- Percentage of Profitable Trades
- Other performance metrics
By using the Strategy Tester, you can quickly see if an idea has merit and refine your strategy to achieve better results.
Getting Started
To get started with automated testing, open the Pine Script Editor by clicking on the ‘Pine Editor’ tab on the top panel.
You'll need to write or import a strategy using Pine Script. TradingView has a repository of community-generated strategies that you can use.
Click on the “Add to Chart” button in the Pine Script editor to overlay the strategy on your main chart.
Access the Strategy Tester located at the bottom of your chart to summarize the strategy’s performance based on historical data.
The Strategy Tester will display various metrics like Total Net Profit, Max Drawdown, Percentage of Profitable Trades, and more.
To refine your strategy, refine parameters in your Pine Script code and re-run the Strategy Tester to optimize your strategy.
To get started with TradingView, you can quickly get your backtesting strategy up and running with their step-by-step guide.
Optimus Futures customers can enjoy TradingView’s robust functionality and features while accessing their low day trading margins.
Here's a summary of the steps to get started with automated testing:
- Open the Pine Script Editor
- Write or import a strategy using Pine Script
- Add the strategy to your chart
- Access the Strategy Tester
- Review and optimize your strategy
Automated with Pine Script
Automated backtesting with Pine Script and Strategy Tester is a powerful tool for testing trading ideas.
To get started, open the Pine Script Editor, located at the top panel of the TradingView platform. Click on the 'Pine Editor' tab to access it.
You can either write your strategy from scratch using Pine Script or import a pre-existing code. TradingView has a repository of community-generated strategies that you can use.
Once you've written or imported a strategy, click on the "Add to Chart" button in the Pine Script editor to overlay the strategy on your main chart.
The Strategy Tester is located at the bottom of your chart, where it will summarize the strategy's performance based on historical data.
The Strategy Tester will display various metrics, including Total Net Profit, Max Drawdown, Percentage of Profitable Trades, and more. The main chart will also visualize where your strategy would have entered and exited trades.
To optimize your strategy, refine parameters in your Pine Script code and re-run the Strategy Tester.
Here's a step-by-step guide to automated backtesting with Pine Script and Strategy Tester:
- Open the Pine Script Editor
- Code or Import a Strategy
- Add Strategy to Chart
- Access Strategy Tester
- Review Results
- Optimization
Backtesting Tools
TradingView offers a rich set of tools to facilitate backtesting, including the Bar Replay Function and Pine Script. The Bar Replay Function enables manual backtesting, while Pine Script allows you to code your own strategies and backtest them using the Strategy Tester.
A different take: Tradingview Replay
The Strategy Tester is a powerful tool that provides key metrics like profit/loss, win rate, drawdowns, and risk-reward ratios. Traders can test different parameters, timeframes, and asset classes to measure a strategy's profitability.
To get started with backtesting, open the Pine Editor and write or modify a script using Pine Script. Then, apply it to a chart and use the Strategy Tester to analyze historical performance and optimize the strategy based on past data.
Overview of Tools
Backtesting Tools are essential for traders to refine their strategies and minimize risks. TradingView offers a rich set of tools to facilitate backtesting.
The Bar Replay Function is a manual backtesting tool that allows you to test your strategy on historical data. It's a great way to test your ideas without having to write code.
Pine Script is a powerful scripting language that lets you code your own strategies and backtest them using the Strategy Tester. With Pine Script, you can create complex trading logic and analyze its performance on historical data.
You might like: Strategy Consulting Tools
The Strategy Tester provides key metrics like profit/loss, win rate, drawdowns, and risk-reward ratios, helping traders refine their approach before real trading. These metrics give you a clear picture of your strategy's strengths and weaknesses.
To get started with backtesting, open the Pine Editor and write or modify a script using Pine Script. Apply it to a chart and use the Strategy Tester to analyze historical performance.
Master Your Back Test & Boost Profits
You can run backtests on any market and timeframe available on TradingView by clicking on the available timeframes on the top of the current chart or by setting a custom timeframe. This makes it easy to test your strategy on different markets and timeframes.
To truly understand your backtest results, you need to know what "good" and "bad" look like across several key metrics, such as the equity curve, profit factor, max drawdown, total trades, and win rate vs. average loss.
A smooth, consistent upward slope on the equity curve is a sign of a potentially robust strategy. On the other hand, a jagged, volatile, or flat equity curve is a red flag.
You can test your strategy on other markets by clicking on the watchlist icon and selecting the market you want to backtest. You can also search for a new market to test by clicking on the current market ticker.
To make your backtests more realistic, you need to account for trading costs, such as commissions and slippage. A strategy might look like a world-beater on paper, but those seemingly small costs can eat away at profits and turn a winner into a loser.
Here are some key settings to configure for realistic backtesting results:
- Account Size & Base Currency
- Order Size & Pyramiding
- Commission and Slippage
- Advanced Execution Settings
By customizing these settings, you can ensure that your backtesting results accurately reflect potential live performance.
To get started with manual backtesting, use the Bar Replay tool to go back and relive any market session, candle by candle, as if it were unfolding live. This is the ultimate training ground for discretionary traders who need to sharpen their chart-reading instincts.
After running your backtest, TradingView provides a wealth of data for review, including the Overview Tab, Performance Tab, and Trade Analysis & List of Trades. This detailed breakdown is invaluable for refining your strategy and understanding its strengths and weaknesses.
By mastering the backtest process and customizing your testing settings, you can boost your profits and develop a robust trading strategy.
Take a look at this: How to Backtest on Tradingview
Customization and Deployment
Customizing the Strategy Tester is crucial to mirror real trading conditions. You can configure your initial balance, base currency, order size, and pyramiding settings to simulate real-world trading conditions.
To customize your strategy, you can use the Pine Editor, which is TradingView's coding environment. You can take an existing strategy and fine-tune it to fit your personal trading style.
To deploy your customized strategy, you can add it to your chart and access the Strategy Tester, which will summarize the strategy's performance based on historical data. The Strategy Tester will display various metrics like Total Net Profit, Max Drawdown, Percentage of Profitable Trades, and more.
Recommended read: Chatgpt Trading Strategy Tradingview
You can refine parameters in your Pine Script code and re-run the Strategy Tester to optimize your strategy.
Here's a quick rundown of the deployment process:
Customizing with Pine Editor
The Pine Editor is TradingView's coding environment, where every indicator and strategy is built. It's like the engine room of the platform.
You don't need a programming degree to make meaningful changes in the Pine Editor. The goal is to take something that already works and fine-tune it.
To customize a strategy, you can use the Pine Editor to code in your own entry and exit conditions. This is done using Pine Script, which is a scripting language specifically designed for TradingView.
One of the most important things to consider when customizing a strategy is to properly account for trading costs. This includes configuring commissions and slippage in your strategy's settings.
Here's a pro tip: If you have a premium TradingView plan, you should be using the Bar Magnifier. This feature makes your backtest far more precise by forcing it to look at a lower timeframe to simulate how your orders would have filled.
To get started with customizing a strategy, you can open the Pine Editor by clicking on the 'Pine Editor' tab on the top panel. From there, you can write your own strategy using Pine Script or import a pre-existing code.
Here's a step-by-step guide to customizing a strategy with the Pine Editor:
1. Open the Pine Editor by clicking on the 'Pine Editor' tab on the top panel.
2. Code or import a strategy using Pine Script.
3. Add the strategy to your chart by clicking on the "Add to Chart" button in the Pine Script editor.
4. Access the Strategy Tester by locating it at the bottom of your chart.
5. Review the results and optimize your strategy by refining parameters in your Pine Script code and re-running the Strategy Tester.
Remember, the key to successful customization is to start with a solid foundation and refine your strategy over time.
Broaden your view: Add Volume on Tradingview
Automated Deployment
Automated deployment is where the rubber meets the road. The Strategy Tester is your command center for putting trading algorithms to the test on TradingView.

Located at the bottom of your chart, this panel lets you load, tweak, and analyze strategies without touching a single line of code. It's the fastest way to see if an idea has any merit.
Getting started is simple - just pop open the "Indicators & Strategies" window and click on the "Strategies" tab. You'll find a whole library of ready-to-go scripts from TradingView and its community.
Clicking on a script, like a classic "Moving Average Crossover", instantly adds it to your chart. This is the first step towards automated deployment.
Data Considerations
Historical data availability varies by market and timeframe, with higher timeframes typically having more data.
You may only have access to two or three years of data on lower timeframes, such as the 4-hour chart and below, which is insufficient for a thorough backtest.
To access the entire data set for a particular market, you'll need to subscribe to the Deep Backtesting feature, available on higher tier paid plans.
This feature is a big downside of the platform, but there are alternatives like Naked Markets that provide more historical data and ongoing updates for a one-time investment.
Best Practices
To get the most out of backtesting on TradingView, it's essential to use adequate data. This means testing over a significant period, not just a few weeks, to get a comprehensive picture.
One crucial aspect to account for is slippage and commissions. In real-life trading, these costs can add up quickly, so make sure your strategy is still profitable when they're taken into account.
To avoid overfitting, it's a good practice to split your data set into 'training' for building your strategy and 'testing' for validating it. This helps prevent your strategy from being too closely tailored to past data.
Regularly reviewing and updating your strategy is also vital. Financial markets are constantly evolving, so it's essential to stay on top of changes and adjust your strategy accordingly.
Here's a checklist to keep in mind:
- Use a significant period of data for backtesting.
- Account for slippage and commissions in your strategy.
- Split your data set into training and testing to avoid overfitting.
- Regularly review and update your strategy to ensure it remains effective.
Featured Images: pexels.com