
In the world of trading, volatility technical indicators are a crucial tool for navigating the markets. They help traders identify potential price movements and make informed decisions.
Bollinger Bands, a popular volatility indicator, consist of three lines: a moving average and two standard deviations above and below. This setup provides a visual representation of price volatility.
A high standard deviation indicates increased price volatility, while a low standard deviation suggests decreased volatility. This can be a valuable insight for traders looking to adjust their strategy.
The Average True Range (ATR) indicator measures the average range of price movements over a given period, giving traders a clear picture of market volatility.
Consider reading: Average True Range
What Are Indicators?
Indicators are a crucial tool for traders. They help gauge the magnitude of price variations in financial products.
Volatility indicators, in particular, assist traders in making well-informed decisions about their purchasing or selling activities. They aid in risk management and strategy adjustments.
Volatility indicators help traders know the periods of high and low volatility in the market. This can provide good trading opportunities.
Traders can use volatility indicators to analyze these periods and make informed decisions.
Common Indicator Types
Bollinger Bands are a type of volatility indicator that can help identify breakouts and assess market conditions.
The Average True Range (ATR) indicator tracks volatility over a certain time period and is a useful tool for identifying strong market movements.
Standard deviation, Keltner channels, and Donchian channels are also common types of volatility indicators, each with its own unique characteristics and uses.
Top 5 Indicators
The Top 5 Indicators for Volatility are a must-know for any trader. They help identify breakouts, set stop-loss levels, and assess market conditions.
Bollinger Bands are one of the top indicators, expanding and contracting based on market volatility. They're excellent for identifying potential breakouts and mean reversion opportunities.
Average True Range (ATR) measures market volatility by calculating the average range between high and low prices over a specified period. It's particularly useful for setting stop-loss levels and determining position sizes.
The VIX measures the market's expectation of 30-day volatility in the S&P 500. It's widely used to gauge overall market sentiment and potential turning points.
Consider reading: Potential Growth Indicator
Keltner Channels use a central moving average with upper and lower bands based on the Average True Range. They can help identify trends and potential reversals.
Donchian Channel Indicator plots the highest high and lowest low over a specified period, creating a channel that expands and contracts with volatility. It's often used in trend-following strategies and breakout trading.
Here are the Top 5 Indicators in a list format for easy reference:
- Bollinger Bands
- Average True Range (ATR)
- VIX
- Keltner Channels
- Donchian Channel Indicator
India Vix
India Vix is a volatility index launched by the National Stock Exchange (NSE) in 2008. It measures the near-term volatility expectations of the Indian markets.
The India Vix is an inverse relationship with the Nifty, meaning that when India Vix falls, Nifty rises, and when India Vix rises, Nifty falls. This is a key concept to understand when analyzing market trends.
A high India Vix indicates higher volatility expectations, which means a significant change in the Nifty. On the other hand, a lower value of India Vix indicates lower volatility expectations, which means minimal change in the Nifty.
For your interest: Inverse Vix Etf 3x

Here's a comparison of India Vix with the widely recognized VIX index:
India Vix is an important indicator for investors to gauge market sentiment and make informed decisions. By understanding the relationship between India Vix and Nifty, investors can better navigate the Indian markets.
Curious to learn more? Check out: VIX
Using Indicators in Trading
Using indicators in trading can be a game-changer for traders who want to make informed decisions. By combining volatility indicators with other technical tools, traders can gain a more comprehensive view of market dynamics, enhancing their decision-making process.
Volatility indicators like ATR, Bollinger Bands, and Standard Deviation are useful in identifying breakouts, setting stop-loss levels, and assessing market conditions. These indicators can be used to generate buy and sell signals, but it's essential to confirm them with other indicators, price patterns, and support/resistance levels.
To avoid common pitfalls of volatility indicators, use them as part of a broader trading strategy that incorporates other technical analysis tools. Here are some key things to keep in mind:
- Confirm signals from volatility indicators with other indicators, price patterns, and support/resistance levels.
- Avoid making trading decisions based solely on volatility indicators.
- Consider multiple factors when making trading decisions.
By following these guidelines, traders can use volatility indicators in a way that complements their overall trading strategy, rather than relying solely on these indicators.
Setting Stop-Loss Levels

Setting Stop-Loss Levels is a crucial aspect of trading, and volatility indicators can help you determine the right levels.
ATR and Bollinger Bands are useful in identifying breakouts and setting stop-loss levels. The lower band can act as a trailing stop-loss level, raising the stop-loss with the uptrend.
In an uptrend, prices generally move up near the upper Bollinger Band as momentum increases. As the uptrend starts losing steam, price will pull back from the upper band toward the middle band, which is a moving average.
Trend traders can place a stop-loss order below the middle band and trail the stop upward along with the middle band as the trend progresses. More conservative traders could place the stop-loss below the lower Bollinger Band, further away from the current price action.
Here's a summary of stop-loss placement strategies:
In this chart, we will be able to observe how price action interacts with the Bollinger Bands over time. During trending periods, the price tends to stay within the bands, often using the middle band as a dynamic support or resistance level.
See what others are reading: Bollinger Bands Thinkorswim
Trading Systems

Trading systems that utilize volatility indicators can be incredibly effective in identifying potential profit opportunities. These systems leverage market fluctuations to generate buy and sell signals.
Volatility-based trading systems can be implemented in various ways, including using quantitative algorithms for high-frequency volatility trading. This approach allows traders to quickly adapt to changing market conditions and capitalize on volatility spikes.
To create a robust trading system, it's essential to incorporate multiple volatility indicators, such as Average True Range (ATR), which measures price volatility. This helps to confirm trend strength and potential reversals.
Here are five key aspects of volatility-based trading systems:
- Utilize indicators like ATR to measure price volatility
- Implement breakout strategies based on volatility spikes
- Incorporate volatility filters to confirm trend strength and potential reversals
- Use quantitative algorithms for high-frequency volatility trading
- Adapt position sizing and risk management based on current market volatility levels
By incorporating these elements, traders can create a well-rounded trading system that takes into account market fluctuations and adjusts to changing conditions.
Buy and Sell Signals
Buy and Sell Signals are generated using Donchian Channels, a 2-in-1 volatility indicator that provides clear signals for traders. These signals are based on the price's relationship to the upper and lower bands of the channel.
For another approach, see: Intraday Trading Signals

Prices hitting the lower band signal a buy opportunity, while prices reaching the upper band indicate a sell opportunity. This is because the price breaking above the upper channel suggests a potential uptrend or continuation of an existing uptrend.
Buy signals are typically generated when the price decisively moves above the upper Donchian Channel, as shown by the green circles on the chart. This indicates a potential uptrend or continuation of an existing uptrend.
Sell signals are identified when the price drops below the lower Donchian Channel, suggesting a potential downtrend or continuation of an existing downtrend. The chart shows two sell signals marked by blue circles, where the price breaks below the lower channel.
Here's a summary of the Buy and Sell Signals generated by Donchian Channels:
It's crucial to remember that these tools are most effective when used in conjunction with other forms of analysis and within the context of a well-defined trading plan tailored to individual risk tolerance and market understanding.
Understanding Ratios

The volatility ratio is a measure that helps investors follow the volatility of a stock's price. It's one of a few technical indicators focused on volatility, and it's typically used in conjunction with other indicators to identify trading opportunities.
The standard deviation is a common measure used for following volatility, and it forms the basis for several technical channels, including Bollinger Bands. This is because standard deviation helps reveal insights about current market conditions.
To understand ratios, it's essential to know that the volatility ratio was developed to contribute to the analysis of price volatility. Across the industry, volatility and volatility ratio calculations may vary, but the most common version takes the proportion of an asset's day true range to its average true range.
VIX
The VIX is a widely recognized indicator of the stock market's anticipatory volatility, as determined by S&P 500 index options. It reflects the market's anticipation of the relative intensity of near-term price fluctuations in the S&P 500 Index.
For another approach, see: Sp 500 Technical Analysis
The VIX is calculated by aggregating the weighted prices of out-of-the-money puts and calls in order to derive expected volatility. It's determined by using options that expire in 16 and 44 days, respectively.
To calculate the VIX, you need to select put and call options on the S&P 500 index that expire in 30 days. Next, calculate the mid-point of the bid and ask price for each option to estimate the expected price of the option.
The VIX is then weighted based on the delta of each option, with options further from the current S&P 500 price getting lower weighting. A weighted average of the put and call option prices generates a single 30-day expected volatility figure.
The 30-day VIX level is then annualized by multiplying it by the square root of 12, and transformed into an index by multiplying the resulting annualized volatility by 100.
Here's a step-by-step summary of the VIX calculation process:
- Select put and call options on the S&P 500 index that expire in 30 days.
- Calculate the mid-point of the bid and ask price for each option.
- Weight the prices based on the delta of each option.
- Take a weighted average of the put and call option prices.
- Annualize the 30-day VIX level by multiplying it by the square root of 12.
- Transform it into an index by multiplying the resulting annualized volatility by 100.
The Ratio
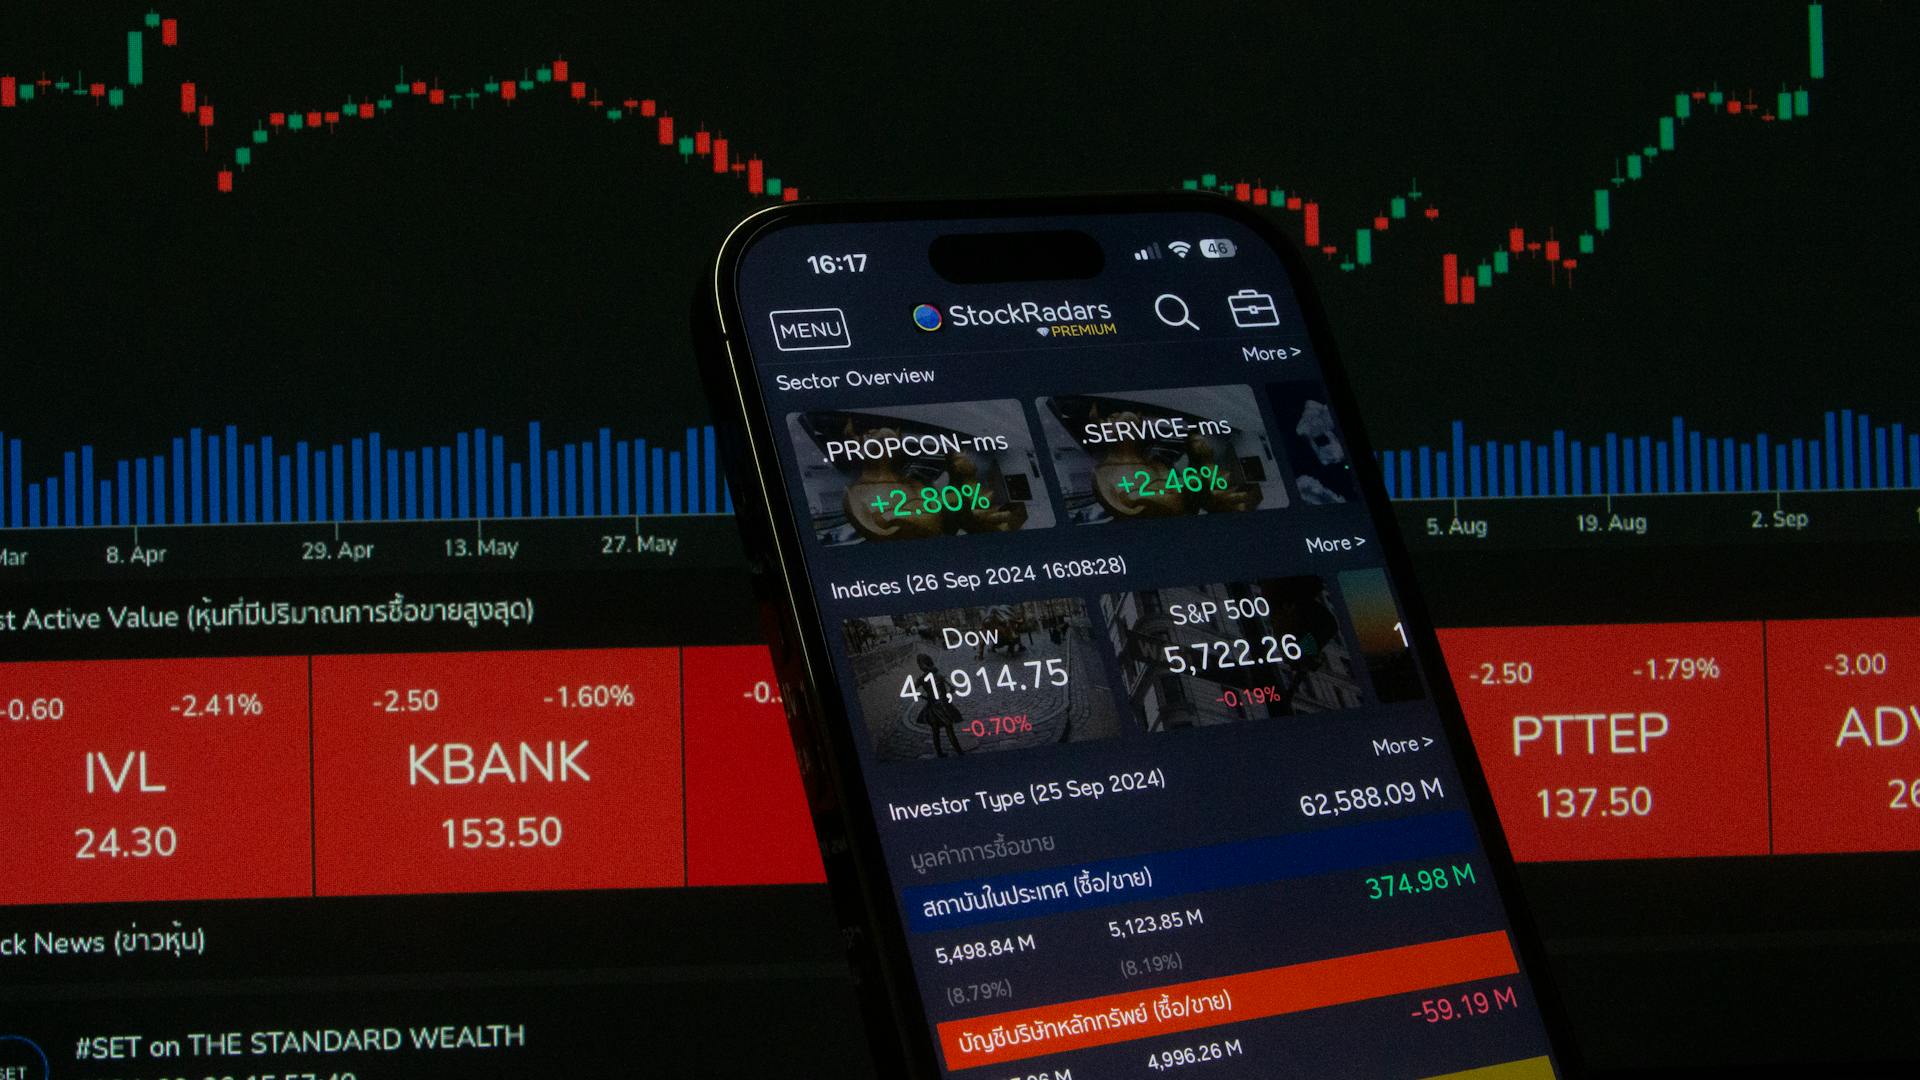
The volatility ratio is a technical measure used to identify price patterns and breakouts. It's a key tool for traders and investors who want to understand the volatility of a stock's price.
A higher volatility ratio signals substantial price volatility in the current trading day. This can indicate disturbances or developments affecting the security's price.
The most common version of a volatility ratio takes the proportion of an asset's day true range to its average true range. This is a variation of average true range (ATR), which is a widely used technical indicator.
Here are the different versions of volatility ratios mentioned in the article:
- Schwager's methodology for calculating the volatility ratio
- Other iterations of the volatility ratio, including true range
These different versions of the volatility ratio can provide a more comprehensive understanding of a stock's price movements. By using these ratios in conjunction with other forms of analysis, traders and investors can gain a deeper insight into market conditions.
Bollinger Bands and ATR
Bollinger Bands and ATR are two powerful volatility technical indicators that can help you navigate the markets with confidence.
Bollinger Bands are a type of price envelope that consists of three lines: a middle band, which is a 20-day simple moving average, and two outer bands that are two standard deviations away from the middle band. The bands expand during periods of high volatility and contract during periods of low volatility.
The distance between the bands is determined by the standard deviation, which means that the bands can adapt to fluctuations in the price. This makes Bollinger Bands a valuable tool for traders who want to assess market conditions and identify potential trade opportunities.
One way to use Bollinger Bands is to look for breakouts when the price moves above or below the outer bands. This can indicate a change in trend or a potential reversal.
Here are some key characteristics of Bollinger Bands:
- The middle band is a 20-day simple moving average.
- The outer bands are two standard deviations away from the middle band.
- The bands expand during periods of high volatility and contract during periods of low volatility.
Average True Range (ATR) is another important volatility indicator that measures the true range of a particular number of price bars, usually 14. ATR is a pure volatility measure that does not necessarily indicate a trend.
A rise in ATR indicates higher trading ranges and thus an increase in volatility, while low readings from the ATR indicate periods of quiet or uneventful trading.
Here's a comparison of Bollinger Bands and ATR:
Both Bollinger Bands and ATR can be used in conjunction with other indicators to get a more comprehensive view of the market. By combining these indicators with momentum indicators like RSI or Stochastics, you can identify potential trade opportunities and make more informed trading decisions.
Other Indicators
Combining volatility indicators with other technical tools can provide traders with a more comprehensive view of market dynamics, enhancing their decision-making process. This is because different indicators offer unique insights into market volatility, helping traders develop more robust strategies.
Using Keltner channels alongside momentum indicators helps confirm trends and filter out potential false signals, especially in range-bound or highly volatile markets. By combining these indicators, traders can make more informed decisions based on quantifiable market data.
Here are some ways to combine volatility indicators with other technical tools:
- Using Keltner channels alongside momentum indicators helps confirm trends and filter out potential false signals, especially in range-bound or highly volatile markets.
- Combining volatility-based indicators like Keltner Channels with momentum tools allows for more dynamic stop-loss placement, adapting to changing market conditions.
- The systematic approach of using multiple indicators helps traders overcome emotional biases, promoting more rational decision-making based on quantifiable market data.
- The integration of volatility and momentum indicators improves the ability to identify and confirm genuine breakouts, distinguishing them from false moves.
Combining with Other Indicators
Combining volatility indicators with other technical tools can provide traders with a more comprehensive view of market dynamics, enhancing their decision-making process. This approach helps traders develop more robust strategies that account for various market aspects.
Integrating volatility indicators with momentum indicators can confirm trends and filter out potential false signals, especially in range-bound or highly volatile markets. This is because momentum indicators help identify the direction and strength of a trend.
Using multiple indicators can also help traders overcome emotional biases, promoting more rational decision-making based on quantifiable market data. This systematic approach allows traders to make more informed decisions.
Combining volatility and momentum indicators improves the ability to identify and confirm genuine breakouts, distinguishing them from false moves. This is particularly useful in highly volatile markets where false breakouts can occur frequently.
For your interest: Momentum (technical Analysis)
Here are some examples of combining volatility indicators with other technical tools:
By combining volatility indicators with other technical tools, traders can gain a deeper understanding of market dynamics and make more informed trading decisions.
Keltner Channel
The Keltner Channel is a technical analysis indicator that helps evaluate fluctuations in price action. It's constructed to identify unusual strength or weakness in the market.
The Keltner Channel consists of three separate channels: a central moving average line and channel lines that are situated both above and below the central one. This indicator is named after Chester W., an American trader.
The Keltner Channel is typically calculated over a period of 20. The upper and lower bands expand and contract in accordance with the volatility. The formulas for these bands are as follows:
- Keltner Channel Middle Line = EMA
- Keltner Channel Upper Band = EMA+2*ATR
- Keltner Channel Lower Band = EMA-2*ATR
The EMA is typically collected over a period of 20, while the ATR is typically collected over a period of 10 or 20. The multiplier is usually set to 2.
The central line acts as a dynamic support and resistance level, while the upper and lower channel lines serve as dynamic overbought and oversold indicators. A breakout above the upper band can signal unusual strength, while a breakout below the lower band can signal unusual weakness.
The width of the channels expands and contracts with volatility. When volatility increases, the channels widen, and when it decreases, they narrow. This dynamic nature allows traders to adjust their strategies based on current market conditions.
The Keltner Channel is used to evaluate fluctuations in price action and identify unusual strength or weakness in the market. It's a useful tool for traders to make informed decisions about entries, exits, and risk management in their trading and investment strategies.
You might like: Donchian Channel Thinkorswim
Conclusion and Tips
Average True Range is a volatility indicator that shines in unsettled markets, reflecting recent price activity that other measures often miss. This makes it a valuable tool for setting stops that respect risk management.
It includes gaps created by overnight news events and trading, which can add to volatility levels. This is particularly useful for traders who want to recognize the impact of these events on a stock's price.
As a guide for setting stops, Average True Range can help you avoid overly tight stops that might not account for market fluctuations. Even fundamental investors may find this technical analysis useful in times of market volatility.
This indicator can give you perspective on exactly how volatile a stock has been, helping you make more informed decisions about your investments.
If this caught your attention, see: How to Know If Stock Is Undervalued
Frequently Asked Questions
What are the 4 types of volatility?
There are four main types of volatility: future, historical, forecast, and implied, each providing a unique perspective on market uncertainty. Understanding these different types of volatility is crucial for making informed investment decisions and navigating financial markets.
What is the rule of 16 in volatility?
The "rule of 16" is a simple method to annualize daily market price movements, where you multiply the daily movement by 16 to get the annual volatility. This rule helps investors quickly estimate the annual volatility of a market price index.
Featured Images: pexels.com