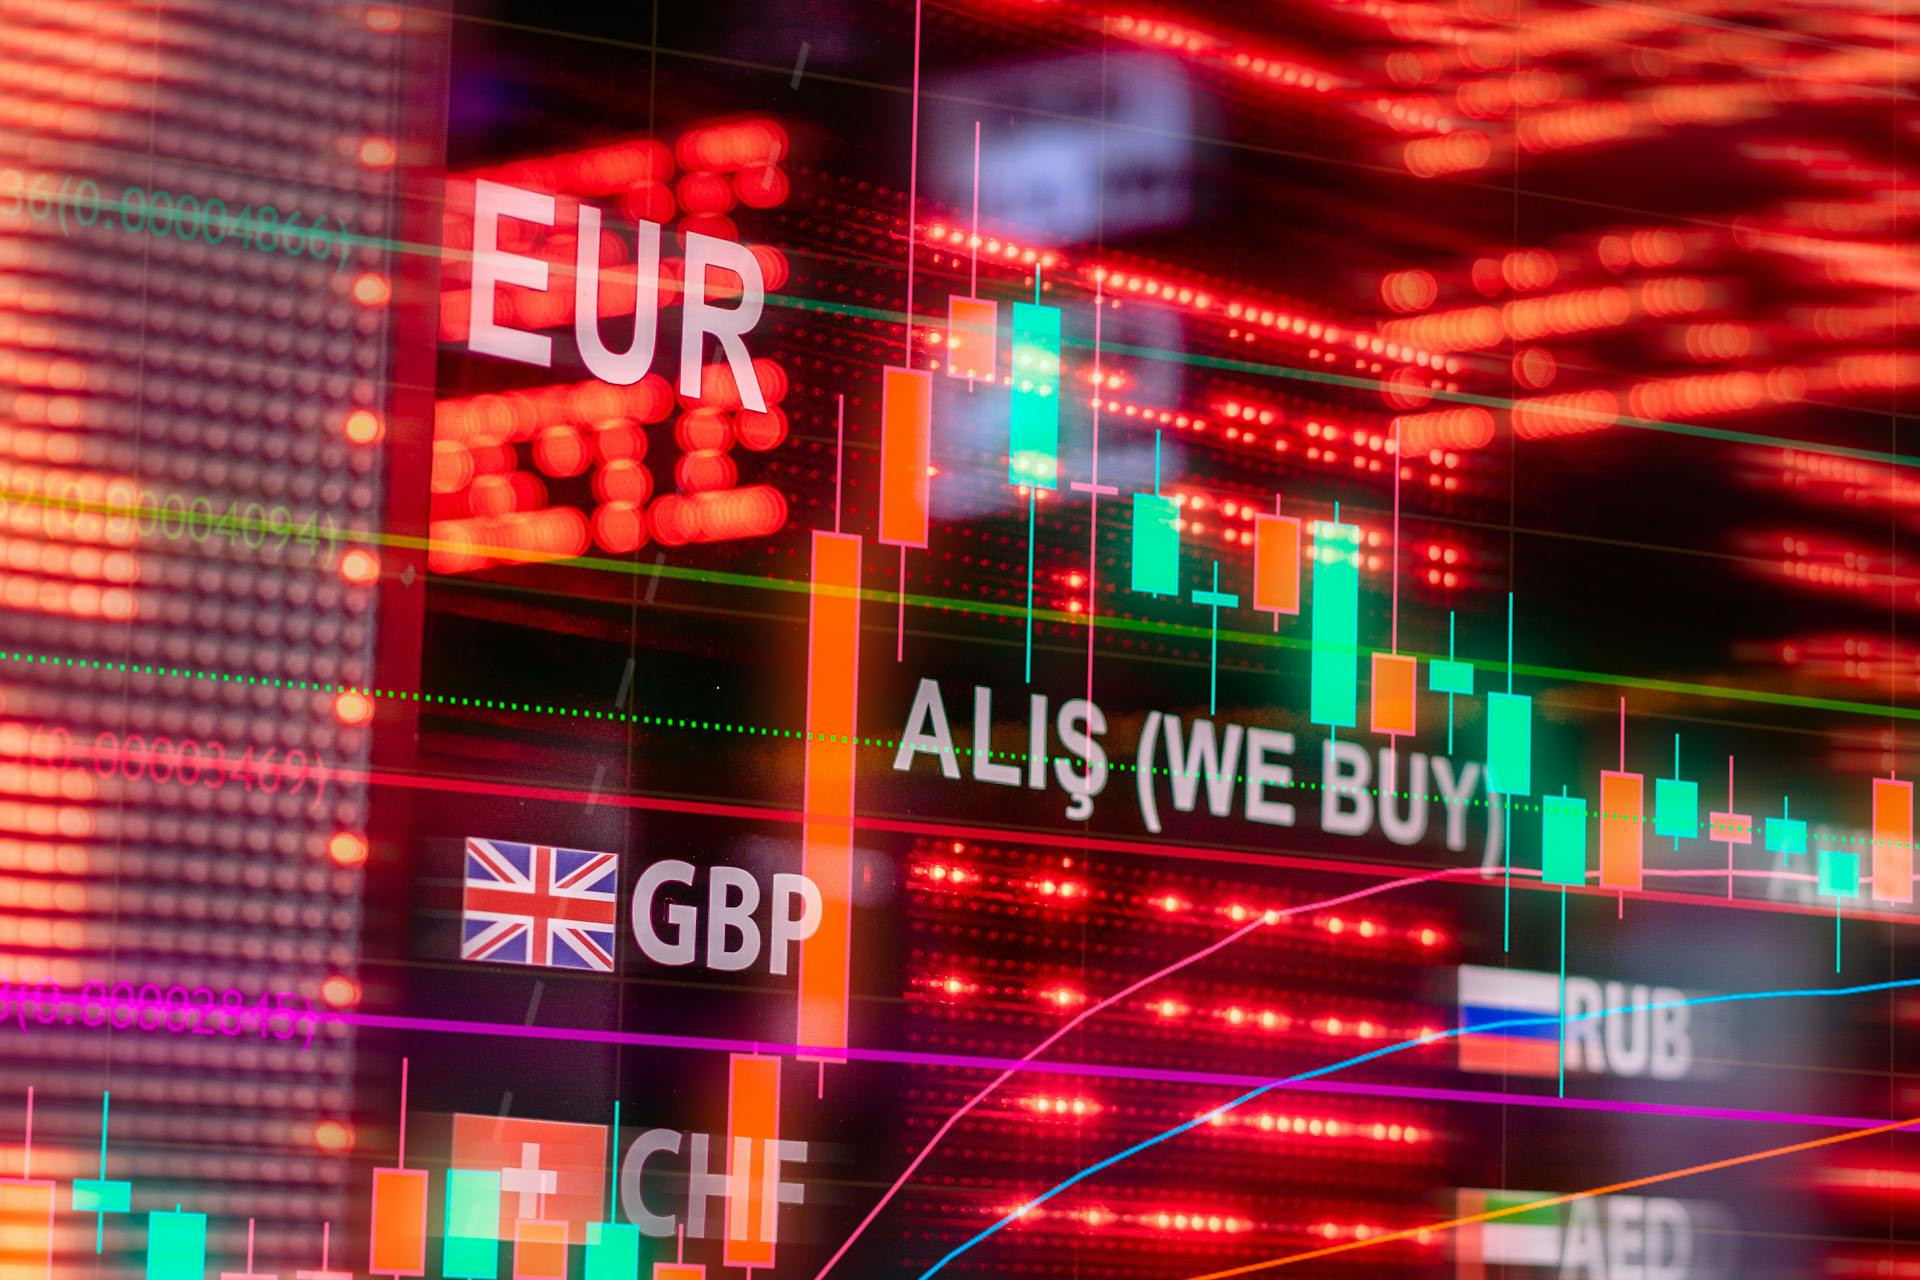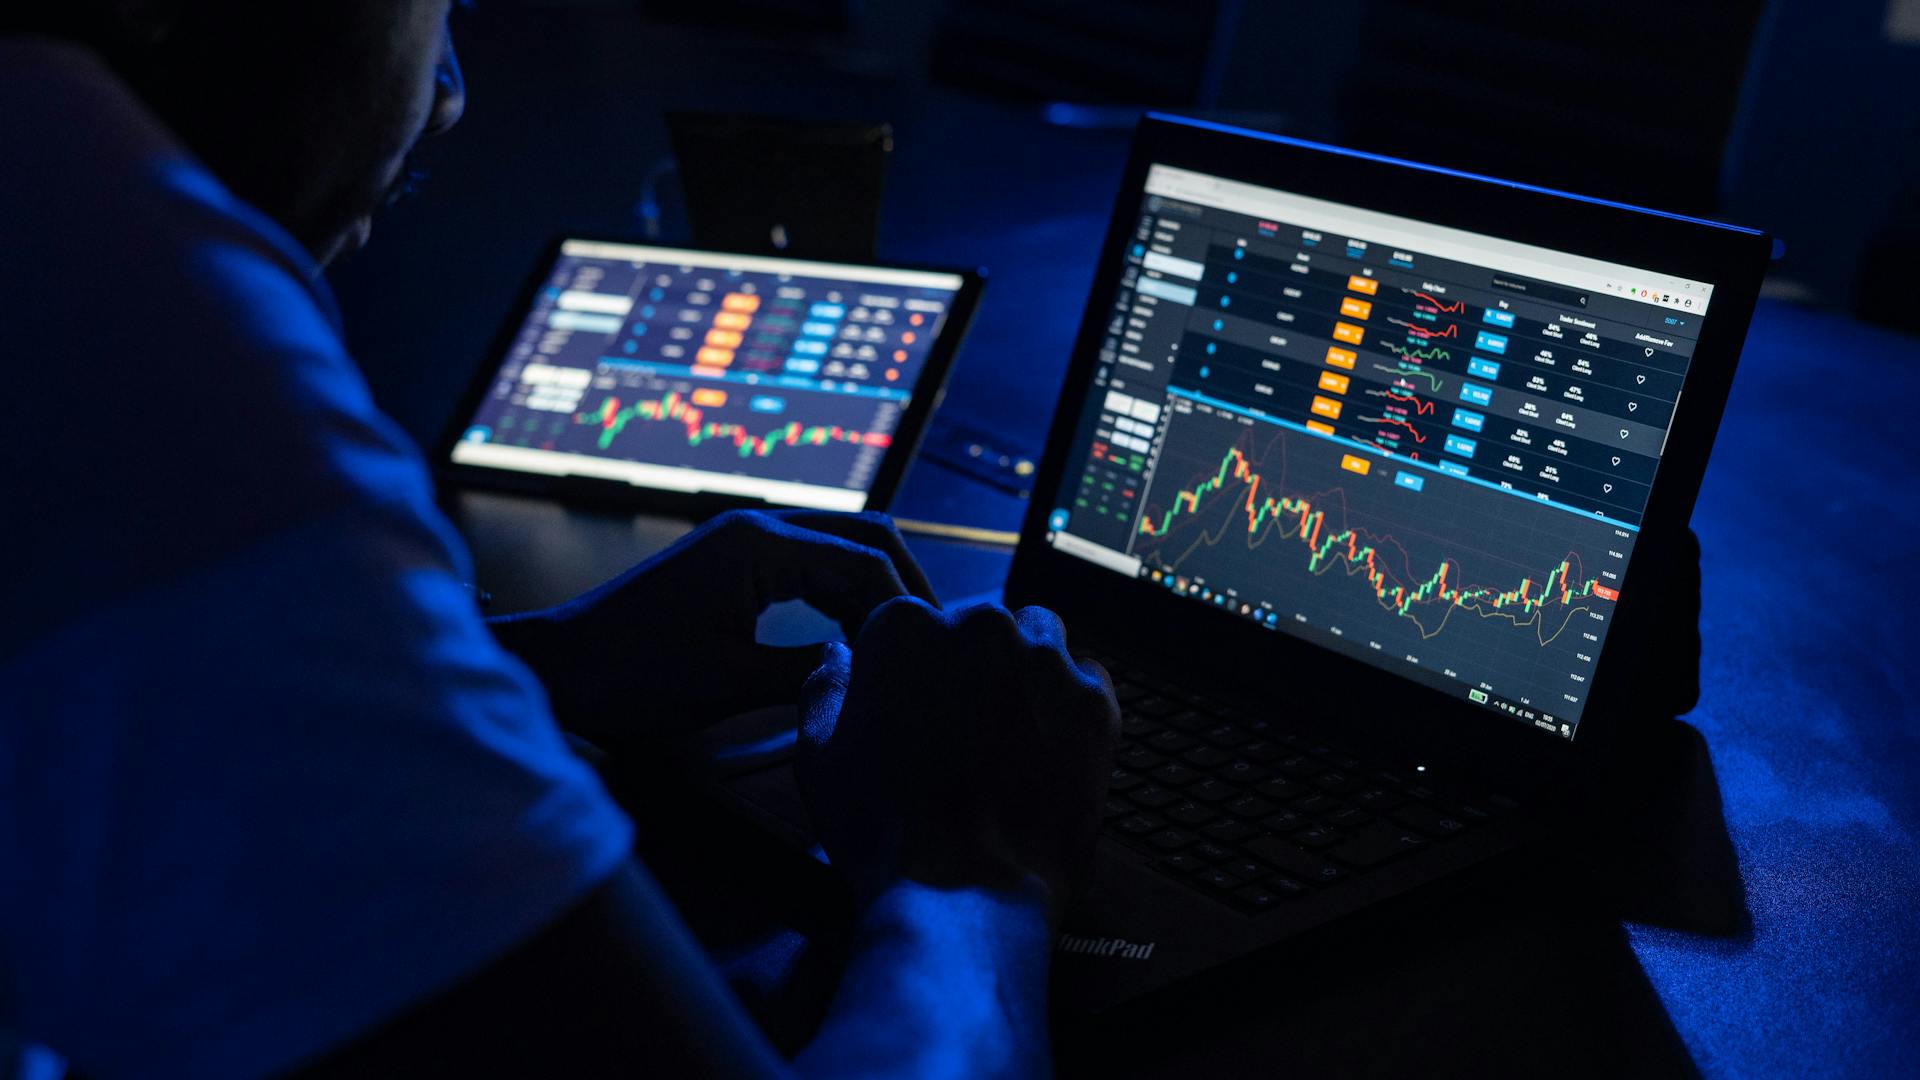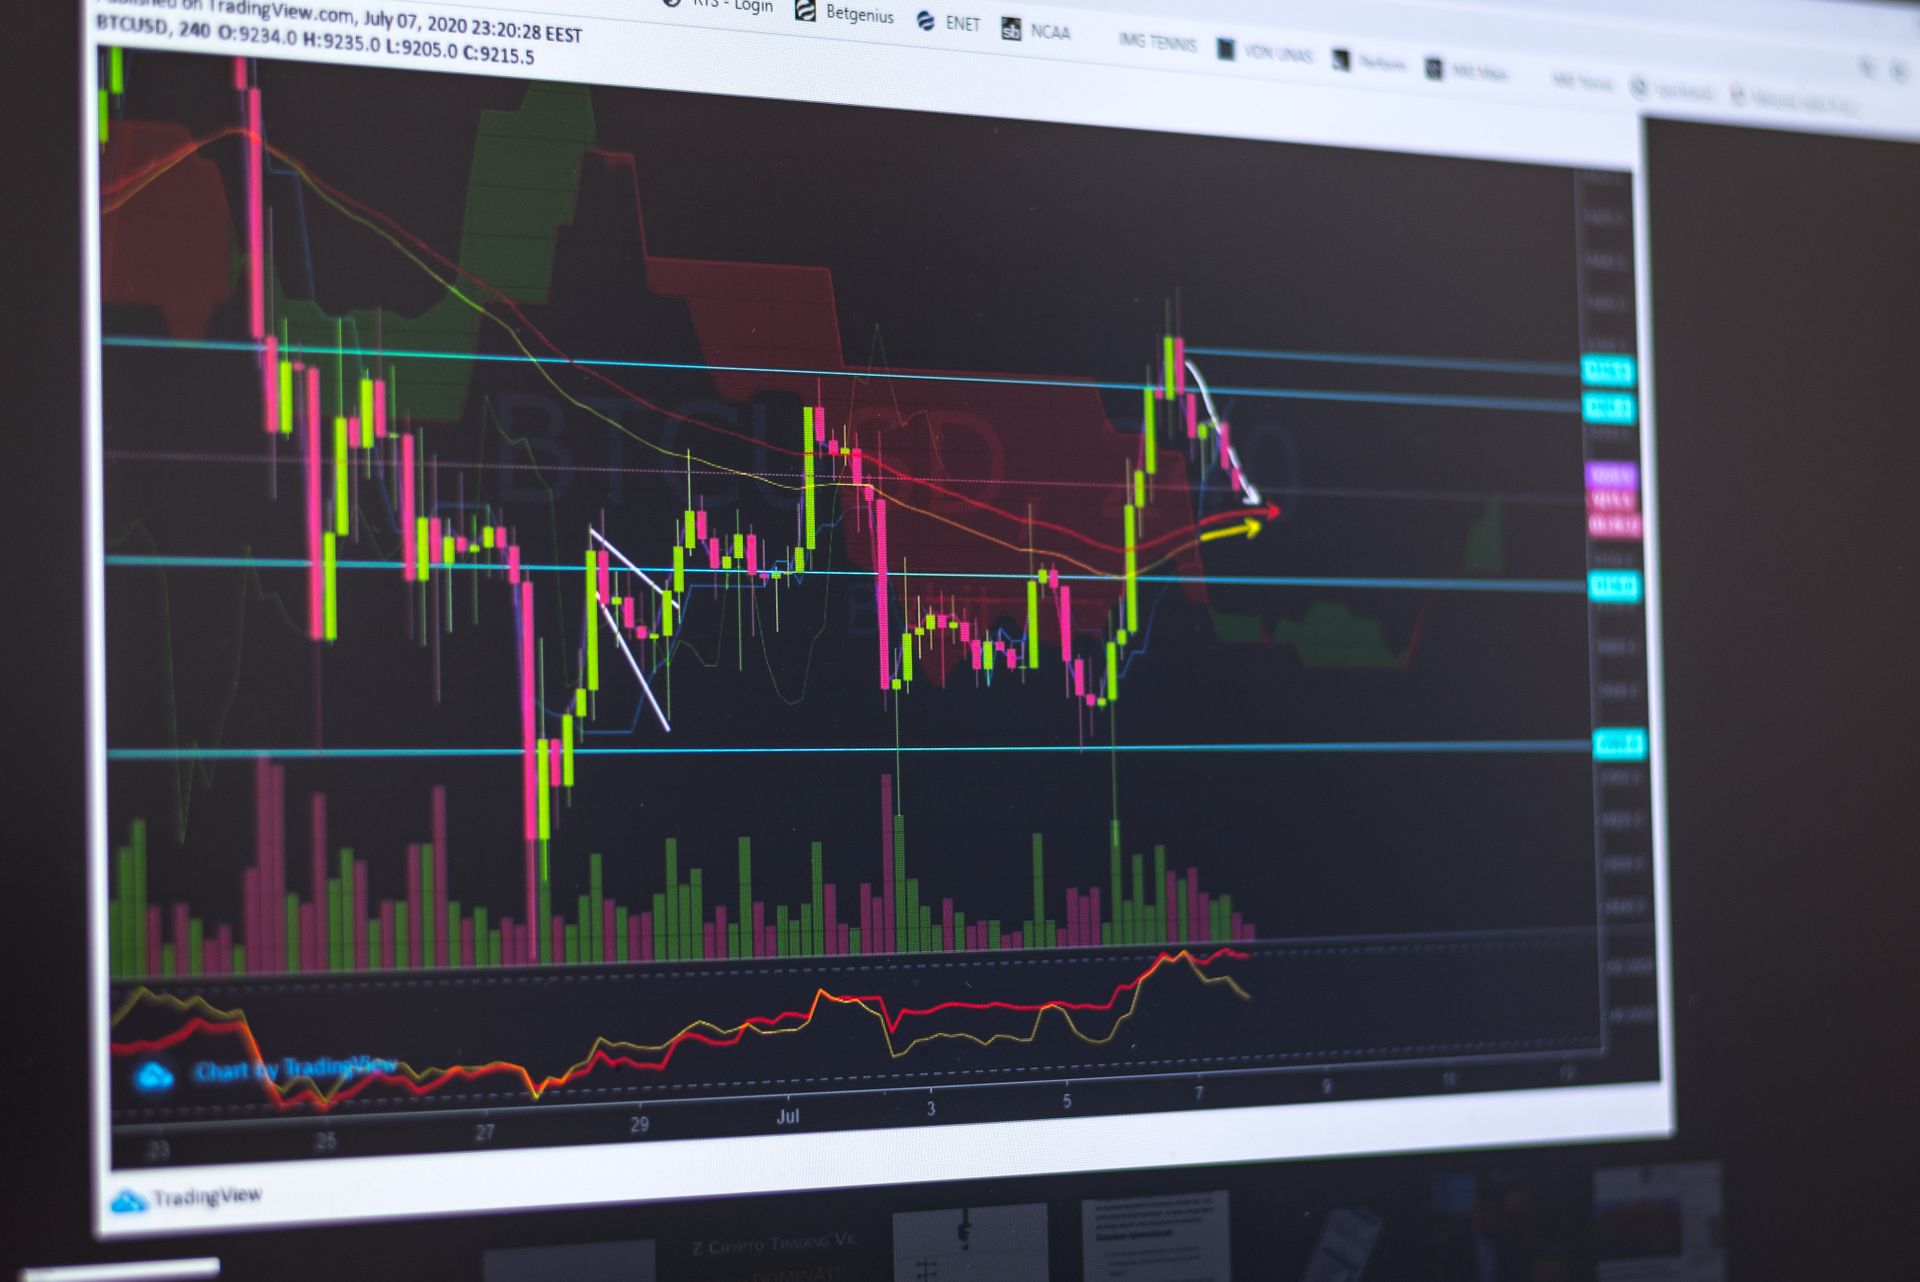
Technical indicators are a crucial tool for traders, helping them make informed decisions in the fast-paced world of Forex. They provide a visual representation of market data, making it easier to identify trends and patterns.
The Moving Average Convergence Divergence (MACD) indicator, for example, is a popular choice among traders. It measures the difference between two moving averages, helping traders identify potential buy and sell signals. A MACD line crossing above the signal line can indicate a bullish trend, while a crossing below can signal a bearish trend.
A single moving average can also be used to gauge the overall direction of the market. A 50-period moving average, for instance, can provide a general sense of the market's momentum. If the price is above the 50-period moving average, it may be a sign of an uptrend, while a price below could indicate a downtrend.
Bollinger Bands are another type of indicator that can help traders gauge market volatility. These bands consist of a moving average and two standard deviations plotted above and below it. The bands can expand and contract depending on market conditions, making it easier to identify potential breakouts.
Consider reading: Potential Growth Indicator
Technical Indicators
Technical indicators are standardized mathematical measures used to analyze and predict market performance. They can provide valuable insights into potential price reversals, direction, and strength of price trends, and momentum of price movements.
Some of the most popular technical indicators in forex trading include moving averages, Bollinger Bands, the relative strength index (RSI), and the moving average convergence/divergence (MACD). These indicators can be used to identify overbought and oversold conditions, as well as potential reversals.
To get the most out of technical indicators, it's essential to use them effectively. This means avoiding clutter on your charts by not using too many similar indicators, and combining indicators that complement each other, such as RSI with MACD or Bollinger Bands with Moving Averages.
Here are some popular technical indicators and their uses:
- Moving average (MA): Highlights trend direction and strength
- Bollinger Bands: Highlights volatility and potential breakout opportunities
- Average true range (ATR): Measures volatility
- Moving average convergence/divergence (MACD): Identifies trend direction and potential reversals
- Fibonacci retracements: Identifies potential reversal levels
- Relative strength index (RSI): Identifies overbought and oversold conditions
- Pivot point: Identifies potential support and resistance levels
- Stochastic: Identifies overbought and oversold conditions
- Parabolic SAR: Identifies potential reversal points
- Ichimoku Cloud: Identifies potential trend reversals and support/resistance levels
What Are Indicators?
Indicators are standardized, mathematical measures or metrics used to analyze and predict market performance based on patterns detected from tracking the market over time.
They're portrayed through chart pattern graphics, and some of the most popular indicators in trading are moving averages, Bollinger Bands, the relative strength index (RSI), and the moving average convergence/divergence (MACD).
Indicators can point towards potential price reversals, direction and strength of price trends, and momentum of price movements.
What's tracked by an indicator is underpinned by what type of indicator is used, such as trend-following, momentum, volatility, or volume indicator.
While indicators provide likely price movement based on analyzing relevant market data, there's no guarantee that it'll transpire as expected.
Many traders prefer to base their decisions on a combination of parallels across multiple indicators, weeding out contradictions.
Here are some of the most popular types of indicators:
- Moving average (MA)
- Bollinger Bands
- Average true range (ATR)
- Moving average convergence/divergence (MACD)
- Fibonacci retracements
- Relative strength index (RSI)
- Pivot point
- Stochastic
- Parabolic SAR
- Ichimoku Cloud
Technical Indicators
Technical indicators are a crucial part of technical analysis, providing valuable insights into market trends and potential price movements. They can be used to identify overbought and oversold conditions, trend directions, and momentum.
The Relative Strength Index (RSI) is a popular momentum oscillator that measures the speed and change of price movements, ranging from 0 to 100. It's used to identify overbought and oversold extremities, with readings above 70 indicating overbought conditions and below 30 indicating oversold conditions.
Bollinger Bands are used to measure market volatility, acting like mini support and resistance levels. They consist of a middle SMA line with two outer bands representing standard deviations from this average, creating a channel around price action.
The Moving Average Convergence Divergence (MACD) is a trend-following momentum indicator that displays the relationship between two moving averages. It consists of a fast line, slow line, and histogram, which represents the difference between the MACD and the signal line.
Here are some key points to keep in mind when using technical indicators:
- Avoid using similar indicators, such as two momentum indicators, as it may clutter charts without adding significant value.
- Complementary combinations, such as RSI with MACD or Bollinger Bands with Moving Averages, can offer insights into both trend strength and momentum.
- Multiple timeframes can be used to gauge the broader trend while identifying precise entry and exit points.
Some popular technical indicators include:
- Moving Average (MA)
- Bollinger Bands
- Average True Range (ATR)
- Moving Average Convergence Divergence (MACD)
- Fibonacci Retracement
- Relative Strength Index (RSI)
- Stochastic
- Parabolic SAR
- Ichimoku Cloud
Popular Indicators
Popular indicators are a crucial part of technical analysis in forex trading. They help traders make informed decisions by providing valuable insights into market trends and patterns.
The top 10 forex indicators include the moving average (MA), Bollinger Bands, and average true range (ATR), which are widely used by traders. These indicators can be used to identify trends, measure volatility, and set stop-loss levels.
Here are some of the most popular indicators:
- Moving Average (MA)
- Bollinger Bands
- Average True Range (ATR)
- Moving Average Convergence/Divergence (MACD)
- Fibonacci Retracements
- Relative Strength Index (RSI)
- Pivot Point
- Stochastic
- Parabolic SAR
- Ichimoku Cloud
Pivot Point
The pivot point indicator is a popular tool among forex traders. It shows how the supply and demand levels of an asset compare.
The price crossing the pivot point indicates a disparity in these levels. Higher demand is marked by the price moving above the pivot point, while high supply is indicated by the price falling below the point.
A balance in supply and demand is shown when the price of a currency pair reaches the pivot point. This is determined by the previous trading session's high, low, and closing prices.
To use the pivot point indicator, traders can look at its support and resistance predictions to choose where to enter and exit the market. They can also use it to figure out in which direction the market is trending.
Here are the key points to keep in mind when using the pivot point indicator:
- The pivot point is determined by the previous trading session's high, low, and closing prices.
- The price crossing the pivot point indicates a disparity in supply and demand levels.
- Higher demand is marked by the price moving above the pivot point.
- High supply is indicated by the price falling below the pivot point.
- A balance in supply and demand is shown when the price reaches the pivot point.
Bollinger Bounce
Bollinger Bounce is a trading strategy that relies on the idea that price tends to return to the middle of the Bollinger bands. This strategy is best used in ranging markets.
Curious to learn more? Check out: Forex Hedging Strategy
You buy when the price hits the lower Bollinger band, and you sell when the price hits the upper Bollinger band. This strategy is based on the assumption that price will bounce back to the middle of the bands after a move.
The Bollinger Bounce strategy is not suitable for all market conditions, but it can be effective in ranging markets where price is stuck between two levels. By using Bollinger bands, traders can identify potential buying and selling opportunities.
Here's a summary of the Bollinger Bounce strategy:
- Buy when price hits the lower Bollinger band
- Sell when price hits the upper Bollinger band
- Best used in ranging markets
Fibonacci and Other Tools
Fibonacci retracement levels are horizontal lines drawn at specific price points that can act as potential support and resistance levels, derived from the Fibonacci sequence.
These levels include 23.6%, 38.2%, 50%, 61.8%, and 78.6%, which can be used to predict areas where pullbacks might end, providing opportunities to enter trades in the direction of the main trend.
Fibonacci retracement levels are effective on all timeframes and work extremely well in conjunction with other technical analysis indicators.
You can identify a significant peak and trough in the price chart, then draw the retracement lines to determine possible areas of reversal, as shown in Figure 7.
The Fibonacci tool is a retracement indicator that shows the percentage change in price action from one point to another, based on a mathematical equation rooted in number sequencing.
This indicator can be applied in several ways, such as finding entry points and identifying price points to set stop-loss levels for potentially favourable outcomes.
Fibonacci levels can be used in conjunction with other indicators to confirm potential trades, making them a valuable tool for traders.
Moving Average Strategies
The 50-day and 100-day simple moving averages are widely used by traders around the world.
These two moving averages are often used together to determine the strength of a trend, with a wider delta between them indicating a stronger trend.
A 'Golden Cross' occurs when the 50-day moving average crosses above the 200-day moving average, and is often seen as a sign of a possible reversal after a strong trend.
Discover more: Trend Pivot Indicator for Thinkorswim
Traders also keep an eye out for a 'Death Cross', which happens when the 50-day moving average crosses below the 200-day moving average.
Moving averages can be used as support and resistance levels, especially for intraday trading, by identifying key points where prices tend to bounce back or break through.
The 50, 100, and 200 simple moving averages can be used together to identify these support and resistance levels, as shown on a 15-minute EURUSD chart.
For your interest: Best Day Trader Indicators
Using Indicators Effectively
Avoid clutter on your charts by not using similar indicators, such as two momentum indicators, as it may not add any significant value.
Complementary combinations of indicators can offer valuable insights, like pairing RSI with MACD to gauge trend strength and momentum.
Using multiple timeframes is a good practice, as it allows you to balance indicators across different timeframes and gauge the broader trend while identifying precise entry and exit points.
Here's a list of some popular forex indicators and their uses:
The best indicator for you will depend on your unique trading style, strategies, goals, and risk tolerance.
Frequently Asked Questions
Which technical indicator is the most accurate?
The Stochastic Oscillator is considered one of the most accurate technical indicators for tracking market momentum. However, its effectiveness is often enhanced when combined with other analysis tools.
What is the 90% rule in forex?
The 90% rule in forex warns that 90% of traders risk losing 90% of their capital within 90 days, emphasizing the need for proper education and risk management. This rule highlights the high risks involved in forex trading and the importance of a well-planned approach.
Featured Images: pexels.com